
![[Blog] Africa's Economy Is Growing. Depending on Which Spreadsheet You're Reading](https://uneca.org/sites/default/files/styles/slider_image/public/storyimages/shutterstock_2762727517-2000x667.jpg?itok=Okl5AM0c)
Authors: Lerato Martha Makana and Maria Dombaxi
After taking office in 2024, Senegal's newly elected president commissioned an audit of the country's public finances.[1] The findings challenged figures that had long been reported by the previous administration. The audit revealed a fiscal deficit exceeding 10 per cent of GDP at end-2023, nearly double the roughly 5 per cent previously reported. Public debt was revised from 74.4 per cent of GDP to nearly 100 per cent.[2]
The revised data had immediate consequences. The IMF suspended its $1.8 billion support programme pending corrective measures[3], and Senegal's sovereign dollar bonds fell as investors reacted to the scale of the revisions.[4]
The new government didn't hide this. They found it, and they disclosed it. But the episode left one uncomfortable lesson: ratios that look solid can move dramatically when the numbers behind them change. An independent assessment later noted that the IMF had missed various opportunities to identify the problem. In mission after mission, over five years, in the balance of payments, in the monetary survey, in the national accounts, and, of course, in the fiscal accounts.[5] The system that was supposed to catch the error also missed it.
Senegal is one case and a politically specific one. But the question it raises is bigger than one government's choices. What if the measurement problem isn't always about misreporting? What happens when the debt number is the same, but the GDP underneath it is not?
How Are GDP Estimates Finalised and Why the Source Matters?
Suppose public debt is $60 billion. If GDP is $100 billion, the debt ratio is 60 per cent. If another source reports GDP as $97 billion, the same debt becomes 61.9 per cent. Same debt. Same economy. Different denominator. Different headline.
So, the question is not merely: What is the ratio? It is: Which GDP produced it?
GDP is the closest thing an economy has to an annual receipt, the value of all goods and services produced within a country's borders. For public finance, it sits at the bottom of almost every ratio used to assess and classify a country. Debt-to-GDP. Deficit-to-GDP. Tax revenue-to-GDP. All roads lead to the denominator.
GDP figures are not carved in stone. A country may publish a first estimate and revise it when better information arrives. International databases update at different times, so the same country and year may appear as provisional, revised, or final estimate.
Countries calculate GDP in their own currency first. Differences can begin there, before any conversion into US dollars. They can also appear later if outlets use different exchange rates or update the figures at different times.
That matters when an analyst - or an AI tool - searches for one GDP number. Which version does it find, and does it warn the user when the sources disagree?
ECA's brief covers 54 African countries from 2010 to 2024. Of 1,619 comparisons between national and international local-currency figures, 33.5 per cent differed by at least 3 per cent. The share of the differences ranged from 30.2 per cent for World Bank-NSO comparisons to 36.9 per cent for UNSD-NSO comparisons.
Why does that matter? Because the GDP denominator sits underneath debt-to-GDP, deficit-to-GDP and tax revenue-to-GDP. Change the denominator and the same debt or deficit tells a different story.
Where the Differences Keep Appearing
Figure 5.2: Intensity of Local-Currency Gaps in NSO Comparisons- Source: ECA Statistical Brief ECA/ACS/06/2026]
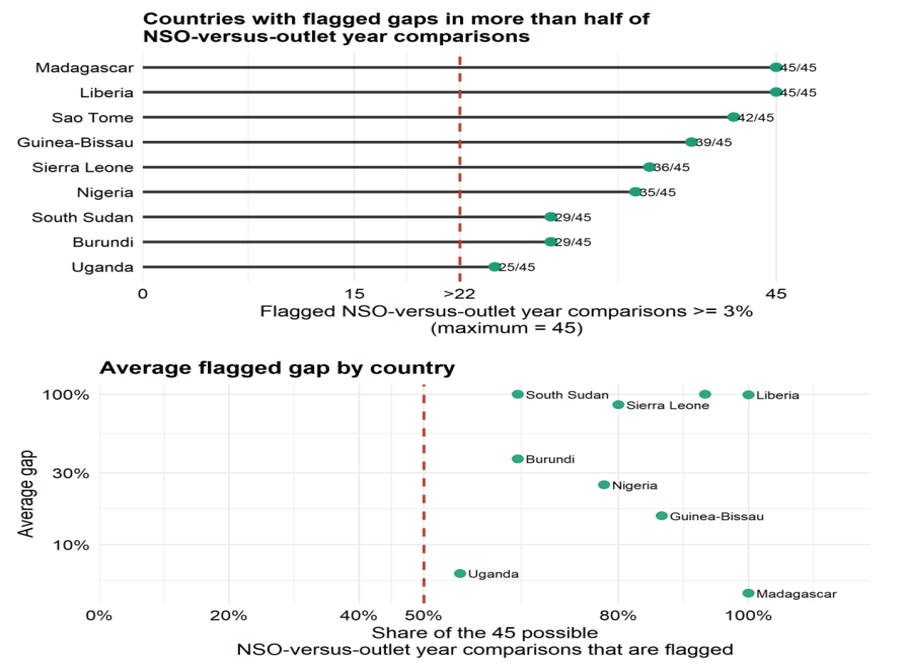
A one-off difference may simply reflect a revision or a late database update. A difference that keeps returning is more important: it tells users to stop and check which version, year and unit they are comparing.
Nine countries crossed the report's repeated-gap threshold. Across their flagged comparisons, the average local-currency gap was 52.6 per cent: Liberia, Madagascar, Sao Tome and Principe, Guinea-Bissau, Sierra Leone, Nigeria, South Sudan, Uganda and Burundi.
Nigeria is a useful example. Thirty-five of its 45 possible NSO-versus-outlet comparisons were at least 3 per cent apart. This does not mean one source must be wrong. It means the figures need to be checked against their dates, revisions and methods before they are used.
The International Outlets Also Differ
Figure 5.6: Outlet-Pattern Windows and USD-Gap Episodes – Source: ECA Statistical Brief ECA/ACS/06/2026]
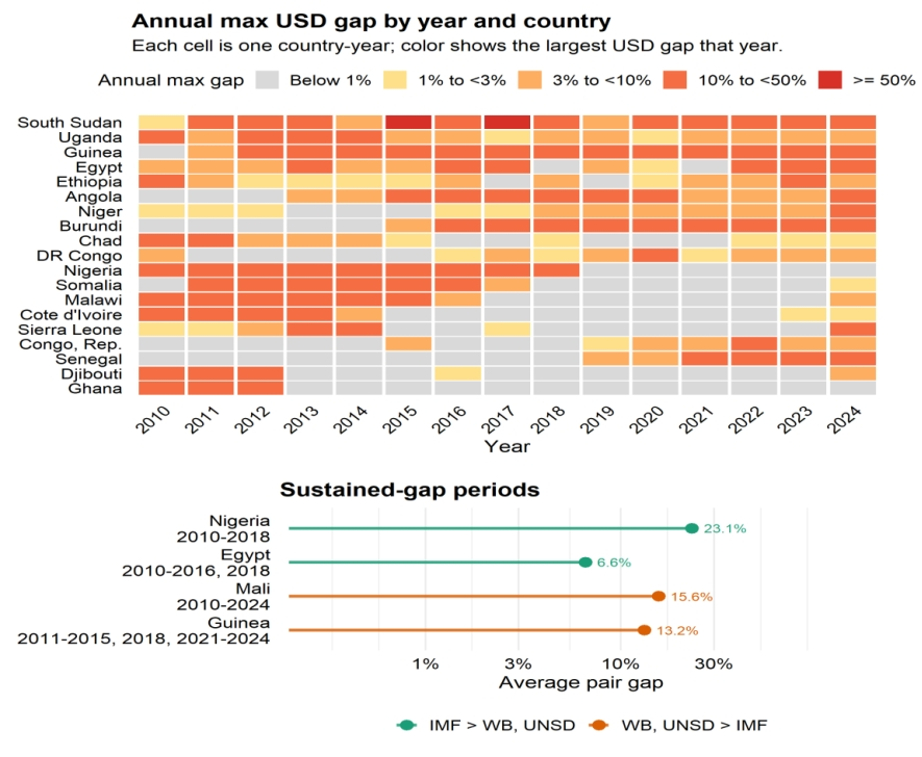
The brief also compared current US dollar GDP from the World Bank, IMF and UN Statistics Division.
Of 2,377 matched comparisons, 25.2 per cent differed by at least 3 per cent. The largest single-year gaps included South Sudan at 66.7 per cent, Angola at 47.8 per cent, Somalia at 42.1 per cent and Ghana at 26.2 per cent. For Nigeria, the IMF figure was higher than those of the other outlets from 2010 to 2018, with an average pairwise gap of 23.1 per cent.
These differences do not prove that an institution is careless or that one database is always better. They show why users need the source, date and status of the number - not just the number itself.
Why Is This Happening?
Usually, three things are at work: the outlets may hold different versions of GDP in local currency; they may use different conversion factors; or they may update at different times. Rebasing, currency changes and fiscal-year differences can add to the problem. The institutions also have different jobs, so a gap is not automatically evidence of poor-quality data.
So Which GDP Figure Should Be Used?
There is no universal answer. For a country-level official report, start with the national statistical office when its data are current and well documented. For cross-country comparisons or regional totals, an international outlet may be more practical.
Whatever the choice, label it clearly. State the source, year, release or retrieval date, and whether the figure is provisional, revised, final, estimated or projected.
And stay consistent. A chart that uses one outlet for some countries and another for the rest may create differences that come from the databases rather than the economies.
When a gap is large or keeps appearing, check the latest national release, revisions, rebasing, currency units, exchange-rate treatment and year alignment before publishing.
ECA's wider proposal is simple: countries and international partners need a shared way to flag, explain and reconcile important differences without pushing aside the official national record.
Different sources will not always produce identical figures. The aim is not to force them into one number, but to make the differences visible and understandable.
The continent knows what it is worth. The task is to show which receipt we are reading - and why.
This blog draws on ECA's statistical brief, "Comparability of Africa's GDP Statistics among National and International Outlets" (ECA/ACS/02/2026, June 2026), African Centre for Statistics, UNECA. https://datalab.uneca.org/docs-acs/sites/default/files/ood-documents/gdp-statistics-06_2026_lw.pdf
[1] Observer Uganda — Audit shows Senegal's previous govt misreported public debt: https://observer.ug/news/audit-shows-senegals-previous-govt-misreported-public-debt/
[2] Reuters via Investing.com — Senegal's dollar bonds fall after audit reveals larger debt and deficit: https://www.investing.com/news/economy-news/senegals-dollar-bonds-fall-after-audit-reveals-larger-debt-and-deficit-3635457
[3] Senenews — IMF freezes $1.8 billion support program for Senegal: https://www.senenews.com/en/senegal/imf-freezes-1-8-billion-support-program-for-senegal-amid-budget-deficit-disclosures-3078.html | Reuters: https://www.reuters.com/world/africa/audit-reveals-senegals-debt-deficit-higher-than-reported-2024-09-26/
[4] Reuters via Investing.com — ibid
[5] Bretton Woods Project — Senegal's hidden debt sparks questions about IMF's oversight: https://www.brettonwoodsproject.org/2025/12/senegals-hidden-debt-sparks-questions-about-imfs-oversight/